CARR for School Districts
The school district CARR data in .csv and STATA .dta format, and the metadata for these files, can be downloaded here. This data will also be published and available for download at the long-term data repository Zenodo.
A file containing the basic descriptive analysis and visualizations provided below can be downloaded here.
To operationalize CARR for school district boundaries we computed area-weighted averages of the original block-group scale CARR. Unified school district (USD) codes for the 2018-2019 school year were used to identify unique school district boundaries in the Composite School District Boundaries dataset1 published by the National Center for Education Statistics. Note that there are only 13,185 unique school district boundaries associated with the 13,256 unique USD codes, so there is some spatial overlap within the school district dataset. These overlaps tend to occur where independently run municipal and independent, or city and county, or elementary and secondary school districts exist in the same place or serve the same population.
In addition to presenting the area weighted average CARR scores, we also independently calculated area weighted averages for each constituent component of CARR. U.S. census urban-rural categorizations and USDA ERS rural urban continuum code (RUCC) classifications were summarized by taking the mode across all block groups intersecting with a school district.
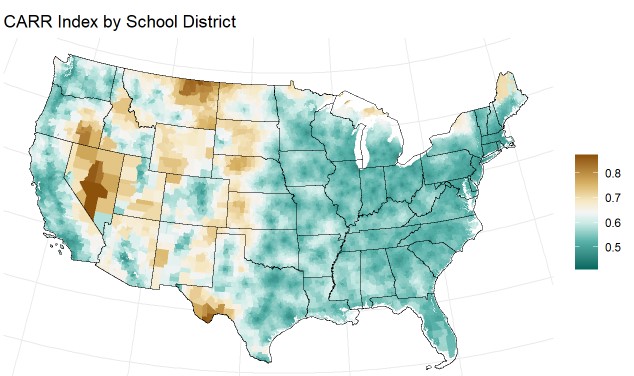
The values of the School District CARR scores fall within the original range of CARR scores (0-1), where a value of 0 means very urban with high concentrations of services and amenities and a value of 1 means very rural with low concentrations of services and amenities.
However, the distribution of CARR by school districts is shifted towards higher scores and the range is compressed (as should be expected from the aggregation process). The minimum score is 0.41, the maximum score is 0.87, and the mean score is 0.55. (In the original CARR the mean value was ~0.5.)

The spatial distribution of CARR across unified school districts is consistent with the original CARR.

Like the original CARR, the index values at the school district level indicate generally higher values of CARR in census designated rural areas but with a large degree of overlap in urban and rural CARR scores.

In addition, the school district CARR scores generally tend to increase with increasing rurality in terms of RUCC but with large amounts of overlap.

The availability component spatial distribution is consistent with the original CARR. Larger values of this component, which has an inverse relationship to the final CARR score, are associated with greater density of services and amenities and are generally found in more developed metropolitan areas. Note that this component has a highly skewed distribution and is log transformed for visualization purposes.

The three accessibility components’ spatial distributions are consistent with the original CARR as well. Larger values of the first accessibility factor are associated with greater distances to amenities. Larger values of the second accessibility factor are associated with increased distance to essential services. Larger values of the third accessibility factor are associated with greater distances to both amenities and natural resource extraction (e.g. peri-urban).


We also see that the relationships between school district CARR and population density, distance to metro areas, and developed land cover meet expectations. CARR has a negative relationship with population density and developed land cover and a positive relationship with distance to metro areas.


References
Footnotes
Geverdt, D. (2019). Education Demographic and Geographic Estimates Program (EDGE): Composite School District Boundaries File Documentation, 2018 (NCES 2017-035). U.S. Department of Education. Washington, DC: National Center for Education Statistics. Retrieved [date] from http://nces.ed.gov/pubsearch.↩︎
Reuse
Kate Nelson
Associate Professor
My research interests include landscape diversity, agricultural adaptation, strategic retreat, vulnerability assessment, and scaling relationships.